
GoGuardian is an Education Technology company that specializes in moderating student web activities by using machine learning to facilitate a better learning environment. We combine dynamic data inputs to calibrate student engagement and help educators draw conclusions about their class sessions. This means that there are a large number of events happening from more than 5 million students every single day. As one can imagine, handling all of these events is quite a challenge.
This is a reposting of a blog post that first appeared on the GoGuardian site. The original posting of this blog can be found here.
This article will detail how we solved our data storage issues and querying challenges with our friends at SingleStore.
OUR ENGINEERING CHALLENGES
Here at GoGuardian, we understand the value and importance of our customers’ data. We consider and evaluate all of the following points, constantly, for all of our projects and products:
–Security: Ensuring the security of our users’ data is our primary concern.
–Data fidelity and retention: We want to reconstruct web activity and any gap in data is a functional failure for our products.
–Scalability and availability: Our systems must scale to meet the need of millions of concurrent users.
–Queryability: Data that is not accessible to our users is useless and should be avoided.
While data security is a priority of its own, and deserves its own write-up, I will not be spending much time discussing it here; it is beyond the scope and intent of this article. However, to address the requirements of data retention and queryability, we have some specific technical challenges:
1. Data generation is cyclical:
Most of our users are students in schools, and many schools choose to disable our products when school is not in session. This means the rate of data generation outside of school hours is drastically lower than when school is in session. This is not as difficult to solve as other challenges, but it does pose a headache for resource allocation because the difference between our peak and trough traffic is quite large.
2. High data throughput:
Our servers receive traffic that is generated by more than 5 million students in real time, and each event translates into multiple writes across different tables and databases. (An event roughly corresponds to a collection of web clicks or navigation events.)
3. Data duplication:
A piece of data we saw at time T0 may be updated and reappear at T0 + t aggregated. These two pieces of data are not identical, but consist of the same key with expanded or updated data. For example, an event may have an array of start and end time pairs of [[T0, T1]]. However, an event with the same key may appear later with start and end time pairs of [[T0, T1], [T2, T3]] if the event re-occurred within a certain time threshold. The updated event encapsulates both new and old data. By storing only the most up-to-date version of each event, we save considerably on row count and storage for many tables, thus reducing overall compute time.
This means that event data is mutable and in some cases we need to update rather than insert. This poses challenges for some databases that are not mutation-friendly. To get around this, we could have redesigned our data generation to support immutable inserts only. However, this would have meant retaining the entire payload of all the generated data, which would make write performance faster but cause the row count to increase, leading to more expensive reads.
We chose to optimize for read performance over write performance due to the dynamic nature of our reads, which is discussed more in the next point.
4. Read query pattern:
Our reads are quite dynamic over many dimensions. We group, aggregate and filter by time, classrooms, student, school, URL, and many other factors. Also, most of our queries are aggregate in nature: less than 6 percent are at the row level while over 94 percent require some kind of ranking or aggregation over a dimension.
We did discuss pre-calculating some of the requests, but in order to make it feasible we would have had to reduce the degree of dimensions and also reduce how dynamic our queries can be. Doing so would have resulted in removing features from our products, which is unacceptable for us and our customers’ experience.
One consolation for us is that our read throughput for this data is not nearly as high as the write throughput. Thanks to various caching strategies, there are about 400 reads per minute.
LEGACY SOLUTIONS
To address our challenges, we had previously implemented various solutions to meet our query needs. Each solution worked well originally. However, we quickly outgrew the legacy implementations that we once relied on.
Before we discuss these, it is important to understand that our intention is not to convey that these solutions are inherently inadequate or insufficient. Instead, what we are trying to say is that when we designed these systems, we had different product requirements than we do now. Eventually, these other solutions no longer fit our needs.
Sharded SQL DBs:
We started out with a single SQL database. At a certain scale, we could no longer rely on a single-instance database. We implemented a sharding solution to split writes across multiple databases based on a key, with each database holding a subset of the data.
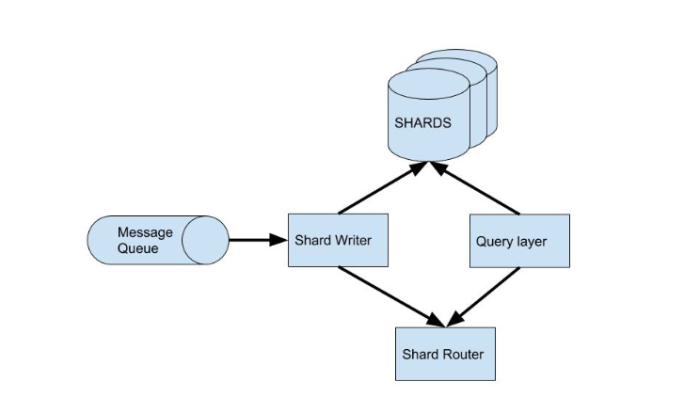
One key thing to note here is that these are sets of relational databases that handle high-throughput browser events. This results in a large quantity of rows per table on each shard. When a table is at such a high scale, queries without indexes will have unreasonable latency and thus the queries need to be carefully crafted, especially when joining with other tables. Otherwise, the databases would lock up and result in cascading effects all the way to our customers.
The relational, row-based SQL databases handled writes relatively well, as expected. However, reads were problematic, especially considering that most of our queries are aggregate in nature, with many dimensions. Adding more SQL DBs and resharding would obviously help, but we were quickly approaching a point where the cadence of potential resharding couldn’t keep up with our growth. When we talk about databases, one of the most often overlooked factors is maintainability. We are often too focused on latency, performance, and cost, but rarely ever talk about maintainability. Shards do not score very high on the maintainability metric for two reasons: the resharding process and the need for a shard router.
Resharding is a resource-straining task and isn’t as simple as adding a database cluster. It needs to be registered with the shard router, load the data for the keys it is now serving, ensure even distribution of the load, etc. These are all possible tasks, but the dull, mundane, and time-consuming nature of that particular work was something we were not thrilled about having to do.
The shard router itself was another problem we faced. As you can see in the architecture diagram above, the operation of these shards is dependent on the shard router service that knows which shard is responsible for each key. The reason why we used this stateful mapping is because not all keys are equal in traffic load, and the degree of variance is quite high. To handle such a variance in workload, we decided to allocate keys to shards based on the expected traffic, which resulted in the need for the shard router service. Our database uptime and performance dependency on this shard router service was an undesirable situation and became even more challenging when resharding was involved.
pros:
-Writes are fast
-Fast simple index based fetch (key based query without aggregation)
cons:
-Aggregate queries are slow (94 percent of our queries)
-Not easy to do cross-shard queries
-We need to maintain a shard router service
-Resharding is an expensive operation
Druid:
Druid is, unlike the sharded SQL DBs we were using, a columnar database that we had adopted to complement our shards. Our shards were great at inserts, but terrible at aggregate queries, so Druid was the response to supplement our aggregate query requirements.
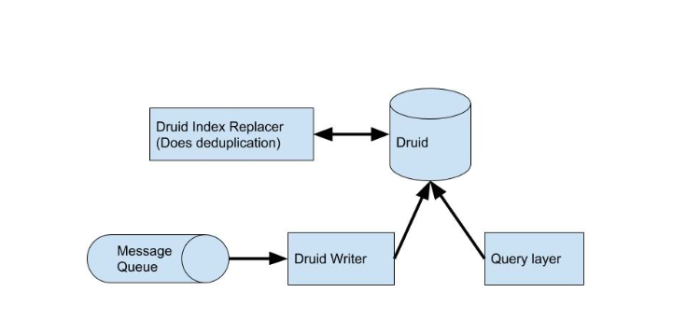
The first point to note about Druid is that it doesn’t do mutation at the row level; there is no row update or delete. The only option for data mutation is to run an index replacement job, which replaces an entire data block in a batch process. Because of the way our data is generated, it necessitates updates of individual rows. This was a major roadblock for us. We ended up having to create non-trivial logic to eliminate the duplicated data during the time threshold when the newer, more correct data could show up. Once the data was finalized, we would trigger a batch job to replace the duplicate data with the finalized, condensed data.
Although we no longer had to maintain a shard router like we did in the case of the SQL shards, we now had to maintain another outside component: the index replacement job. While this is largely facilitated by Druid using a Hadoop cluster, it is yet another dependency we didn’t want to manage.
Druid is not a relational database, so there are no joins. Though this was not a dealbreaker for us, it was definitely something that the engineering team had to adapt to. The way we design queries and tables, as well as how we think about our data, had to change. On top of that, at the time, Druid did not have basic support for SQL, so the query DSL required us to change a lot of the code that we used to query the data.
Druid is a great database that does aggregations across vast amounts of data and dimensions at terrifying speeds (with some query results being “approximate” by design if you read its docs: topn and approx-histograms). I don’t think there was ever a time where we had to worry about the read latency of Druid that wasn’t induced by process or infrastructure failure, which is quite impressive. However, as we continued to use Druid it became painfully obvious that it did not fit our “upsert” use case. Druid is meant for “insert only” where reads can be very dynamic yet still maintain fast latency through various caches and approximations. I’ll be the first to admit that we abused Druid because it wasn’t a perfect fit for the data we were putting into it.
pros:
-Fast aggregate queries
-Distributed by nature, so scaling is easier
cons:
-Had to maintain index replacement job
-Many moving parts (Hadoop, SQL DB, Zookeeper, and various node types)
-No joins and limited SQL support
REDESIGN FROM THE GROUND UP
When we sat down and looked at our incoming data and query patterns, we were at an all-too-familiar place for an engineering team: we needed the best of both worlds. We had fast writes but slow reads with the SQL shards. We also had fast reads but slow, duplicated writes with Druid. What we needed was the fast writes of row-based databases and the fast aggregate reads of columnar databases. Normally this is where we engineers begin to use our “trade-off” and “expectation management” skills.
Nonetheless, in hopes that there were better and cheaper solutions that existed, we began experimenting.
What we have tried:
Again, I cannot emphasize enough that all the databases below have their own strengths and use cases.
1. Phoenix:
Phoenix is an Apache project that adds a layer on top of HBase that allows SQL queries and joins.
Configurations, adaptations, and usage were rather straightforward and we were excited for the potential of Phoenix. However, during our testing we got into an odd state where the entire database was bugged out and no amount of restarts or configuration changes could bring the database back to a functional state. It’s very possible that something went wrong during configuration or usage. However, our production database should be resilient and versatile to the point where any operations should not be able to bring the entire database into an unintentional, unrecoverable and inoperable state.
2. Druid:
Another option was to redesign not only how the data was generated so that updates would no longer be necessary, but to also redesign our Druid schema and services to adapt to such data.
However, the transition and implementation for this is difficult. For zero downtime, we would have had to replicate the data ingestion and storage for an extended period of time. Time, cost, and engineering effort for this was significant. Furthermore, we weren’t completely convinced that insert-only data generation was a better choice over our current method of data generation.
3. BigQuery | Presto | Athena:
Although each of these products are different, the principal idea of the query engine decoupled from the storage is similar; they have similar characteristics of great parallel wide queries but not-so-ideal write throughput.
Of these solutions, BigQuery has the most optimal write throughput, when writing to native BigQuery storage rather than imposing a schema on top of files. However, we would still need to redesign our data generation to reduce write throughput because even BigQuery didn’t fully address our write needs.
Overall, despite us trying various partition strategies and schemas, we couldn’t come up with a confident solution for any of the above. We either ran into another transition difficulty, as we did with Druid, or we had to make compromises in business requirements. They are great for the kind of ad-hoc, non-latency-sensitive queries that are run by our analytics team, but not for our customer-facing products.
4. Spanner:
Spanner is Google’s proprietary, geographically-distributed database that was recently made available to the public via GCP. It is another relational database that shines on strong consistency across multiple regions. For this use case, we didn’t necessarily need the tight and strong consistency that Spanner is known for, but it was a very fast and exciting database to work with.
Spanner is a great product with in depth concepts and fascinating features (such as interleaved-tables) that I was really excited about, and it was one of the most impressive candidates during our testing phase.
The problem we ran into was that the cost projection for our usage was higher than that of our existing legacy systems.
SingleStore
We first learned about SingleStore in the crowded vendor hall of AWS re:Invent 2017. Another engineer and I started sharing our problems with one of their representatives and ended up talking about data throughput, consistency, high availability, transaction isolation, and databases in general.
It was one of the most exciting and enlightening conversations I’ve had, and it changed how we served data at GoGuardian.
Why SingleStore:
SingleStore is a distributed, SQL-compliant database. There are multiple aggregator nodes that serve as the brains of the operation, and multiple leaf nodes that serve as data storage, and the database is coordinated by a single master aggregator.
Through simplicity of design, SingleStore was able to achieve complex operations at low latency.
1. Both row and columnar:
If someone were to ask “is SingleStore columnar or row-based?”, my answer would be “yes”. SingleStore supports both types of storage, defined at table creation time. Perhaps most importantly, it allows unions and joins across row-based and columnar tables.
I cannot stress enough how important this feature is to us, as it fundamentally changed how we served data by giving us the best of both worlds: the fast writes of a row-store and the fast aggregate reads of a column-store.
I don’t know of many database solutions that can support both row and columnar storage types. I certainly don’t know many database solutions that support seamless joins and unions across both types. These features allowed us a degree of flexibility we never had previously.
2. High availability
Machine failure is inevitable and it is something all engineers anticipate and prepare for. We create as many preventions as we can while also preparing for incident mitigation. SingleStore achieves this by making it so that every write is replicated into both a master and a secondary partition. If the original master fails over, the secondary partition becomes the master.
3. Speed
It’s fast. There are some databases that, by design, cannot get better than 500ms latency, regardless of how small or simple the data being queried is. With SingleStore, we are able to see some queries under 30ms when using proper indexes and partition keys.
4. Friendly support
I’ve worked with many big and small companies representing various databases and people. Sometimes, we as technologists run into a product that is new and difficult for us to understand and we need to ask new questions. Sometimes, companies or representative do not handle or communicate very well either by documentation or direct questioning. I’ve been reluctant to use some products based on unresponsiveness and the perceived difficulty of their documentation and community.
The folks at SingleStore were generally very helpful. Ever since our conversation on the crowded floor of AWS re:Invent, all the way through the time when we dropped the multiple legacy databases that were replaced by SingleStore, we have always enjoyed their assistance and friendliness; either in the form of 100+ long email threads or support tickets. It has definitely been a pleasant working experience.
Our architecture:
Let’s recap our challenges.
- Data duplication: data is volatile for a period of time after creation.
- High throughput: capturing all browsing events of five million students.
- Aggregate queries: most queries are not simple row retrieval, but aggregates over several dynamic dimensions.
What if we write to the row-based table and pay a read latency penalty for the short period of time while the data is volatile, and union that table with a columnar table that holds the final data past that volatile time period?
SingleStore allowed us to do this by allowing unions and joins across row and columnar tables seamlessly.
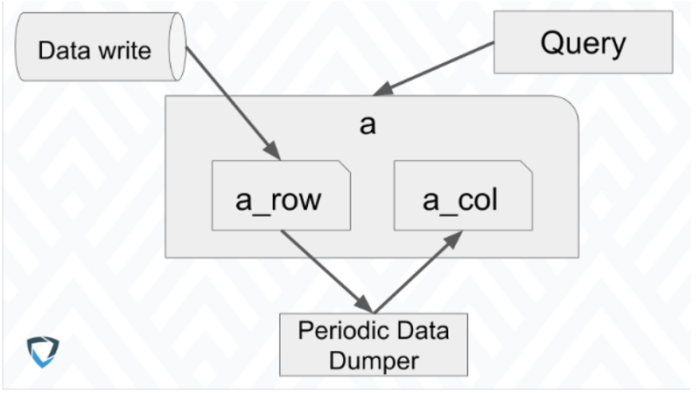
As described above, our stream processor continuously writes our data in real time into a row table. Periodically, our batch process dumps data that has become stable into a columnar table with the same schema. When we read the data, the queries are run against a view that is the union of the row and columnar tables.
Once we figured out the appropriate partition keys that would minimize our data skew, the speed and efficiency we were able to achieve from this architecture was quite stellar.
It is also important to mention that joins are now possible for us. Previously, we couldn’t do joins at all in our columnar storage, and heavily frowned upon it in our row storage due to inefficiency. However, because SingleStore allows us to do both (and it actually works pretty well) we can now have the properly organized and normalized data we data engineers dream about.
Tests:
Any engineering decision requires a sufficient amount of testing and questioning. Below are some of the results of the tests we ran during our experiments with SingleStore.
Here are some points to mention:
- These tests were run during our proof-of-concept phase.
- These test results are based on our specific use case.
- Setup, configuration, design, and code were done by us.
- Each event was inserted into multiple, semi-normalized tables.
- Reads may be joined, aggregated, filtered, or ordered based on sample production load.
- Ran against SingleStoreDB Self-Managed 6.5.
- Our goal was to prove that it could work. Our POC cluster definitely could not handle our production load and our finalized prod environment is bigger and more optimized than the POC.
- You should do your own testing.
1. Isolated read throughput test
Test Setup:
| Node | Type | Count |
|---|---|---|
| Master | m4.2xlarge | 1 |
| Aggregator | m4.2xlarge | 3 |
| Leaf | m4.2xlarge | 4 |
Test result:
| QPS | Test Duration | Latency |
|---|---|---|
| 1 qps | ~20 mins | <200 ms |
| 5 qps | 12 mins | <200 ms |
| 10 qps | 48 mins | <200 ms |
| 20 qps | 96 mins | <300 ms |
| 40 qps | 32 mins | <600 ms |
| 100 qps | 8 mins | ~15 sec |
-Number of parallel read queries per second was continuously increased during the test.
-Read queries were our top most frequent queries with a distribution similar to our production load.
2. Isolated write to row table throughput test
Test Setup:
| Node | Type | Count |
|---|---|---|
| Master | m4.2xlarge | 1 |
| Aggregator | m4.2xlarge | 3 |
| Leaf | m4.2xlarge | 4 |
Test result:
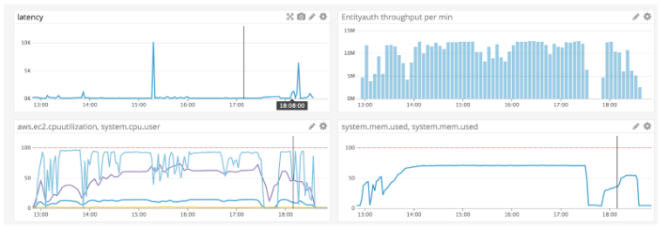
| Stats | Number |
|---|---|
| Avg Latency per 100 events | 27ms |
| Avg Throughput | 2.49m events / min |
| SingleStore Row (RAM usage) | 14.04 gb |
| AVG leaf CPU | 62.34% |
| AVG aggregator CPU | 36.33% |
| AVG master CPU | 13.43% |
-The reason why there was reduced activity around 17:40 to 17:55 was due to faulty code within our test writer that caused out of memory and the test server was restarted and terminated soon after.
3. Read while write
Test Setup:
| Node | Type | Count |
|---|---|---|
| Master | m4.2xlarge | 1 |
| Aggregator | m4.2xlarge | 3 |
| Leaf | m4.2xlarge | 8 |
Test result:
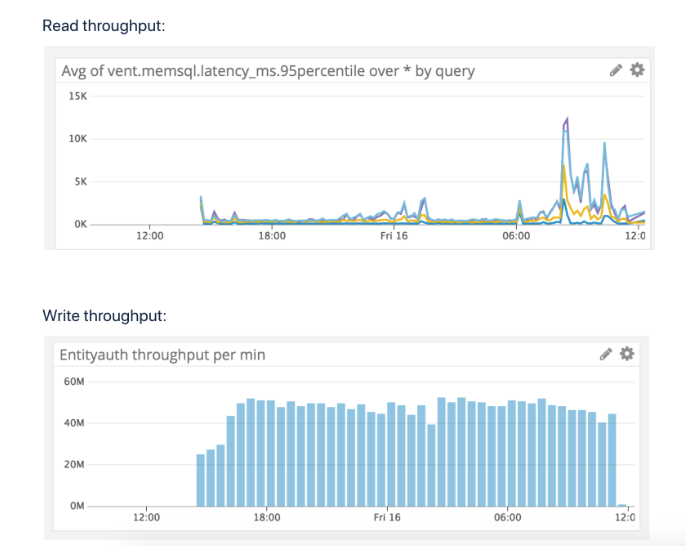
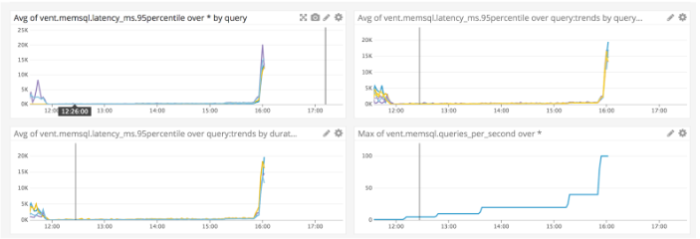
-Read throughput was pegged at 40 qps.
-Write throughput we saw was around 750,000 per second.
-Read latency bump we saw was due to us running ANALYZE and OPTIMIZE query during the run to observe its effects.
Final thoughts
At the end of the day, all the databases that are listed and not listed in here, including SingleStore, Druid, MySQL, Spanner, BigQuery, Presto, Athena, Phoenix, and more, have their own place in this world. The question always comes down to what it takes to make it work for your company’s specific use cases.
For us at GoGuardian, we found SingleStore to be the path of least resistance.
The ability to perform joins and unions across row and columnar tables is definitely a game-changer that allows us to do so much more. SingleStore isn’t without its own problems; but no solution is perfect. There are some workarounds we had to do to make it work for us and there were a few times when we were disappointed. But they are listening to our feedback and improving the product accordingly. For example, when we told them that we really needed the ability to backup our data to S3, one of their engineers sent us an unreleased version with that feature to start testing with. From there we were able to establish a line of communication with their engineering team to round out the feature and even iron out a bug on their end. This line of communication we were able to establish increased our confidence in adopting SingleStore.
Now that everything is up and running smoothly, I’m both proud of what we have accomplished and thankful for the product and the support we have received from the SingleStore team. I have more confidence than ever before in our infrastructure and its ability to handle strenuous loads during peak hours.
Oh, and have I mentioned that we are saving about \$30,000 a month over our previous solutions?
The original posting of this blog can be found here.


